Management Guide
This guide is for people in the MANAGEMENT role — supervisors who review team performance and need to understand the scoring without necessarily editing tickets.
What you'll do here
- Read the Performance dashboard and monthly reports
- Drill into a country / department / KPI to see contributing tickets
- View the live Organization Chart of divisions, departments, heads and agents
- Understand how scores are calculated
Organization & roles
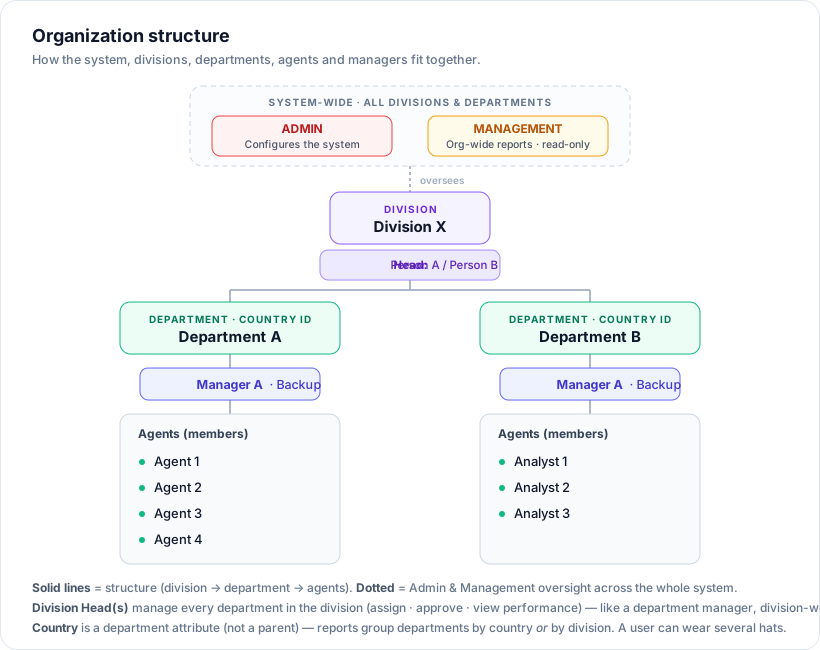
The system is organised division → department → agents, with one or more managers per department, and one or more Division Heads per division. A Division Head manages every department in their division — the same powers as a department manager (assign tickets, approve extensions, view performance), division-wide. Each department also carries a country attribute, so reports can group departments by division or by country:
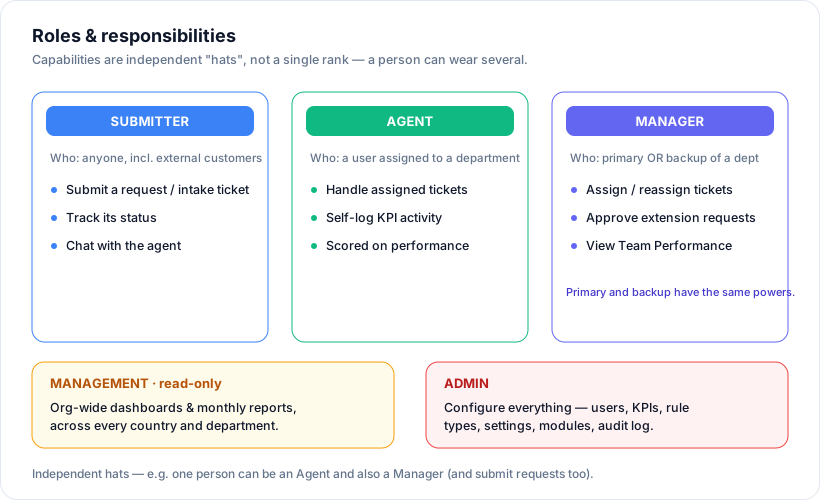
Capabilities are independent "hats" — one person can be a Submitter, an Agent, and a Manager at once. Primary and backup managers have the same powers:
Where to start
After signing in, you land on /performance. Two tabs at the top:
- Dashboard — current-month snapshot per country, plus 6-month trend charts.
- Monthly Report — a single month's KPI rows with country / department filters and drill-down.
Both pages read pre-aggregated tables that the system refreshes when you open them — recomputed only if tickets actually changed since the last view (otherwise the page loads instantly). There's nothing to refresh manually.
Alongside Performance in the top nav (under Insights) is Org Chart — a live picture of the whole organization. See Organization Chart below.
The Dashboard
Cards at the top show, per country, the weighted score for the current month plus a comparison vs. last month. Green = ≥ 95%, yellow = 80–94%, red = below 80%. Numbers are computed as the average of department averages, which are themselves averages of KPI group scores — so a single bad team doesn't drown out a good country.
Below the cards:
- Score trend — six months of scores, per country.
- Uptime chart — only meaningful for KPI groups marked as "contributes to uptime". Shows the percentage of uptime units that hit the 99.5 % threshold each month.
- Critical / Watch list — KPI rows for the current month that scored below thresholds. Tickets needing attention bubble to the top.
Click any country / KPI on the page to open the monthly drilldown prefiltered.
If you manage a department (My Team)
Department managers are designated per department (independent of the read-only MANAGEMENT role — an agent can also be a manager). Each department has one primary manager plus any number of backup managers, and both have the same powers — assignment, reassignment, extension approval, and Team Performance all work identically for a primary or a backup. If you manage one or more departments you get a My Team link in the top nav (→ /manager/pending-tickets) with:
- Pending tickets — unassigned intake tickets in your departments. Pick a teammate from the same department and Assign; they're emailed and the ticket goes On Progress.
- Assigned tickets — open tickets already assigned in your departments. If one went to the wrong person, choose another teammate in the same department and Reassign. The new owner's response/resolution clock restarts, they're emailed, and a note is added to the ticket thread. (Closed/rejected tickets can't be reassigned.)
- Team performance (
/manager/performance) — per-teammate scores; click a teammate to open their profile. You can view the profile of anyone in the departments you manage. Viewable by a department's manager or backup manager. A date-range selector (1 Week / 1 Month / MTD / YTD / All, default YTD) sets the window the counts and average score are computed over — widen it to YTD or All to see monthly-cadence departments such as Finance, whose tickets may fall outside a short recent window. - Extension requests (
/manager/extensions) — approve or decline agents' deadline-extension requests; approving emails the requestor the new due date.
The Monthly Report
- Month picker in the top right — pick a month, page reloads with that month's data.
- Country / Department filters narrow the table.
- KPI rows show: KPI name, KPI type, total tickets, scores per category, weighted score, pass/fail status.
- Click a row to open the drilldown panel showing the actual tickets that contributed.
The drilldown panel
Top stat boxes: Tickets, Response pass rate, Resolution pass rate, etc. (the exact set depends on the rule type).
Table below shows every contributing ticket with: Date, Country, Department, User, Description, Metrics, Score. Click Close to dismiss the panel.
For Uptime drilldowns, the panel splits into:
- Per KPI-Type uptime % (passed / below target)
- The downtime tickets that ate into uptime
Organization Chart
Insights → Org Chart (/org-chart) is a live picture of the whole organization, drawn straight from the current data — no scores, just structure and people:
Board of Directors
 └ Division        (with its Head(s))
     └ Department  (with its country + manager)
         └ Agents
- Divisions show their Head(s) as a name pill. A division can have several heads; each one has manager powers over every department in the division (see Organization & roles).
- Departments show their country and primary manager. Click the agents line on a department to expand the list of its members.
- Departments not yet assigned to a division appear under an Unassigned group, so nothing is hidden.
- The chart scrolls sideways if the organization is wider than the screen.
It updates automatically whenever an admin changes divisions, departments, heads, managers, or user assignments — there's nothing to refresh. To edit the structure, an admin uses Admin → Divisions / Departments / Users.
How scoring works
A ticket's metrics are scored by its rule-type formula into a 0–100% per-ticket score, which is then averaged upward from agent to department to country:
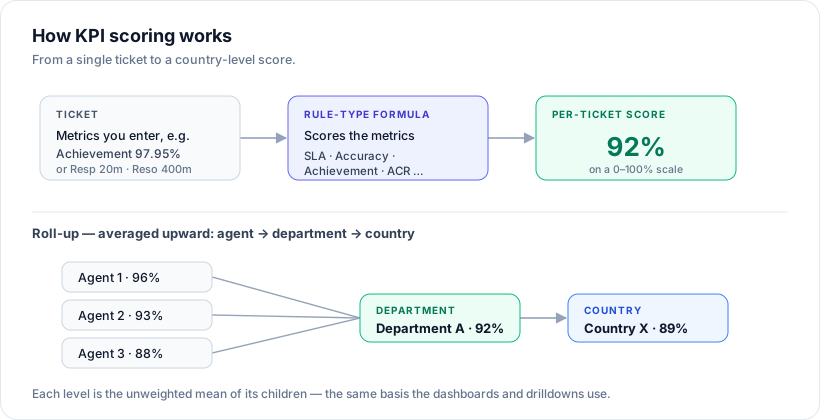
The same departments also roll up by division (the tier parallel to country), so a division's score is the average of its departments — letting you read performance either way. On the dashboard you can drill a division/country all the way down: department → agent → KPI group → KPI type → the individual tickets.
Each KPI Type has a Rule that decides what a "pass" means. Brief reference:
| Rule | What's measured | "Pass" means |
|---|---|---|
| rr | Response time + Resolution time | Both within their SLA-minute targets. Weighted: usually 20% response + 80% resolution. |
| acr | Six 1-5 scores (FRT, Attendance, Finding, Backlog, Teamwork, Obedience) | Weighted average of normalized scores. Higher is better. |
| accuracy | Response accuracy %, Data accuracy % | Each compared to its target; weighted sum. |
| submit | Daily submit time | Before the cutoff (default 12:00). |
| project | Project count | At least one project recorded. |
| ic-cctv-regular / ic-cctv-adhoc / ic-sop-report / ic-sop-findings / ic-closure / ic-sop-proposal / ic-backlog-qc | Internal Control rules | Each has bespoke logic: completion %, find/close within N working days, minimum findings, on-time SOP report, and backlog Qualified Chat as Number of Qualified Chats / Total Qualified Chats. |
| uptime | Aggregated from other tickets | (Working minutes − downtime) / working minutes per unit. Pass at 99.5%. |
Working hours and holidays
Time-based rules use the per-country working hours (timezone, workday start/end, working days of week) plus the holidays calendar for that country. Tickets dated outside working hours / on holidays are excluded by default — unless the ticket has "Count as weekend/holiday work" ticked or the KPI Type has the "ignoreWorkingDayFilter" toggle on.
Weighting
The weighted score on a row combines the rule's component scores using the weights configured on the KPI Type's parameters (admins manage these). The country-level weighted score averages dept → KPI-group averages so structure matters: one country with three departments contributes three department averages. The division-level score works the same way, averaging the departments assigned to that division.
Reading a row
Take an example rr-rule row:
| Field | Meaning |
|---|---|
| Tickets | Number of contributing tickets this month |
| Resp OK | How many tickets had response time ≤ target |
| Reso OK | How many tickets had resolution time ≤ target |
| Resp SLA % | Resp OK ÷ Tickets |
| Reso SLA % | Reso OK ÷ Tickets |
| Score | Weighted average per the KPI Type's respWeight / resoWeight |
A row that's Resp SLA = 100%, Reso SLA = 50%, weights 20/80, scores at (0.2 × 1.0) + (0.8 × 0.5) = 0.60 — 60%.
Frequently asked
A ticket I expected to see in the drilldown isn't there. Likely it's either: (a) outside this month, (b) dated to a non-working day without the override, (c) not yet assigned a user, or (d) using a KPI Type that's not part of this report row.
Numbers don't match what an agent reports. The data here always reflects what's currently in the database — there's no offline cache. If you and the agent disagree, look at the audit log (admins can show this) to see what was edited and when.
Can I export to Excel? Not in v1. The drilldown panel is the closest thing — copy the table contents from the browser. Ask an admin if a CSV export is needed.
Why are some scores hidden / blank? "-" means the KPI row had no scorable tickets this month (no contributing data). Different from "0%" (which means there were tickets but none passed).